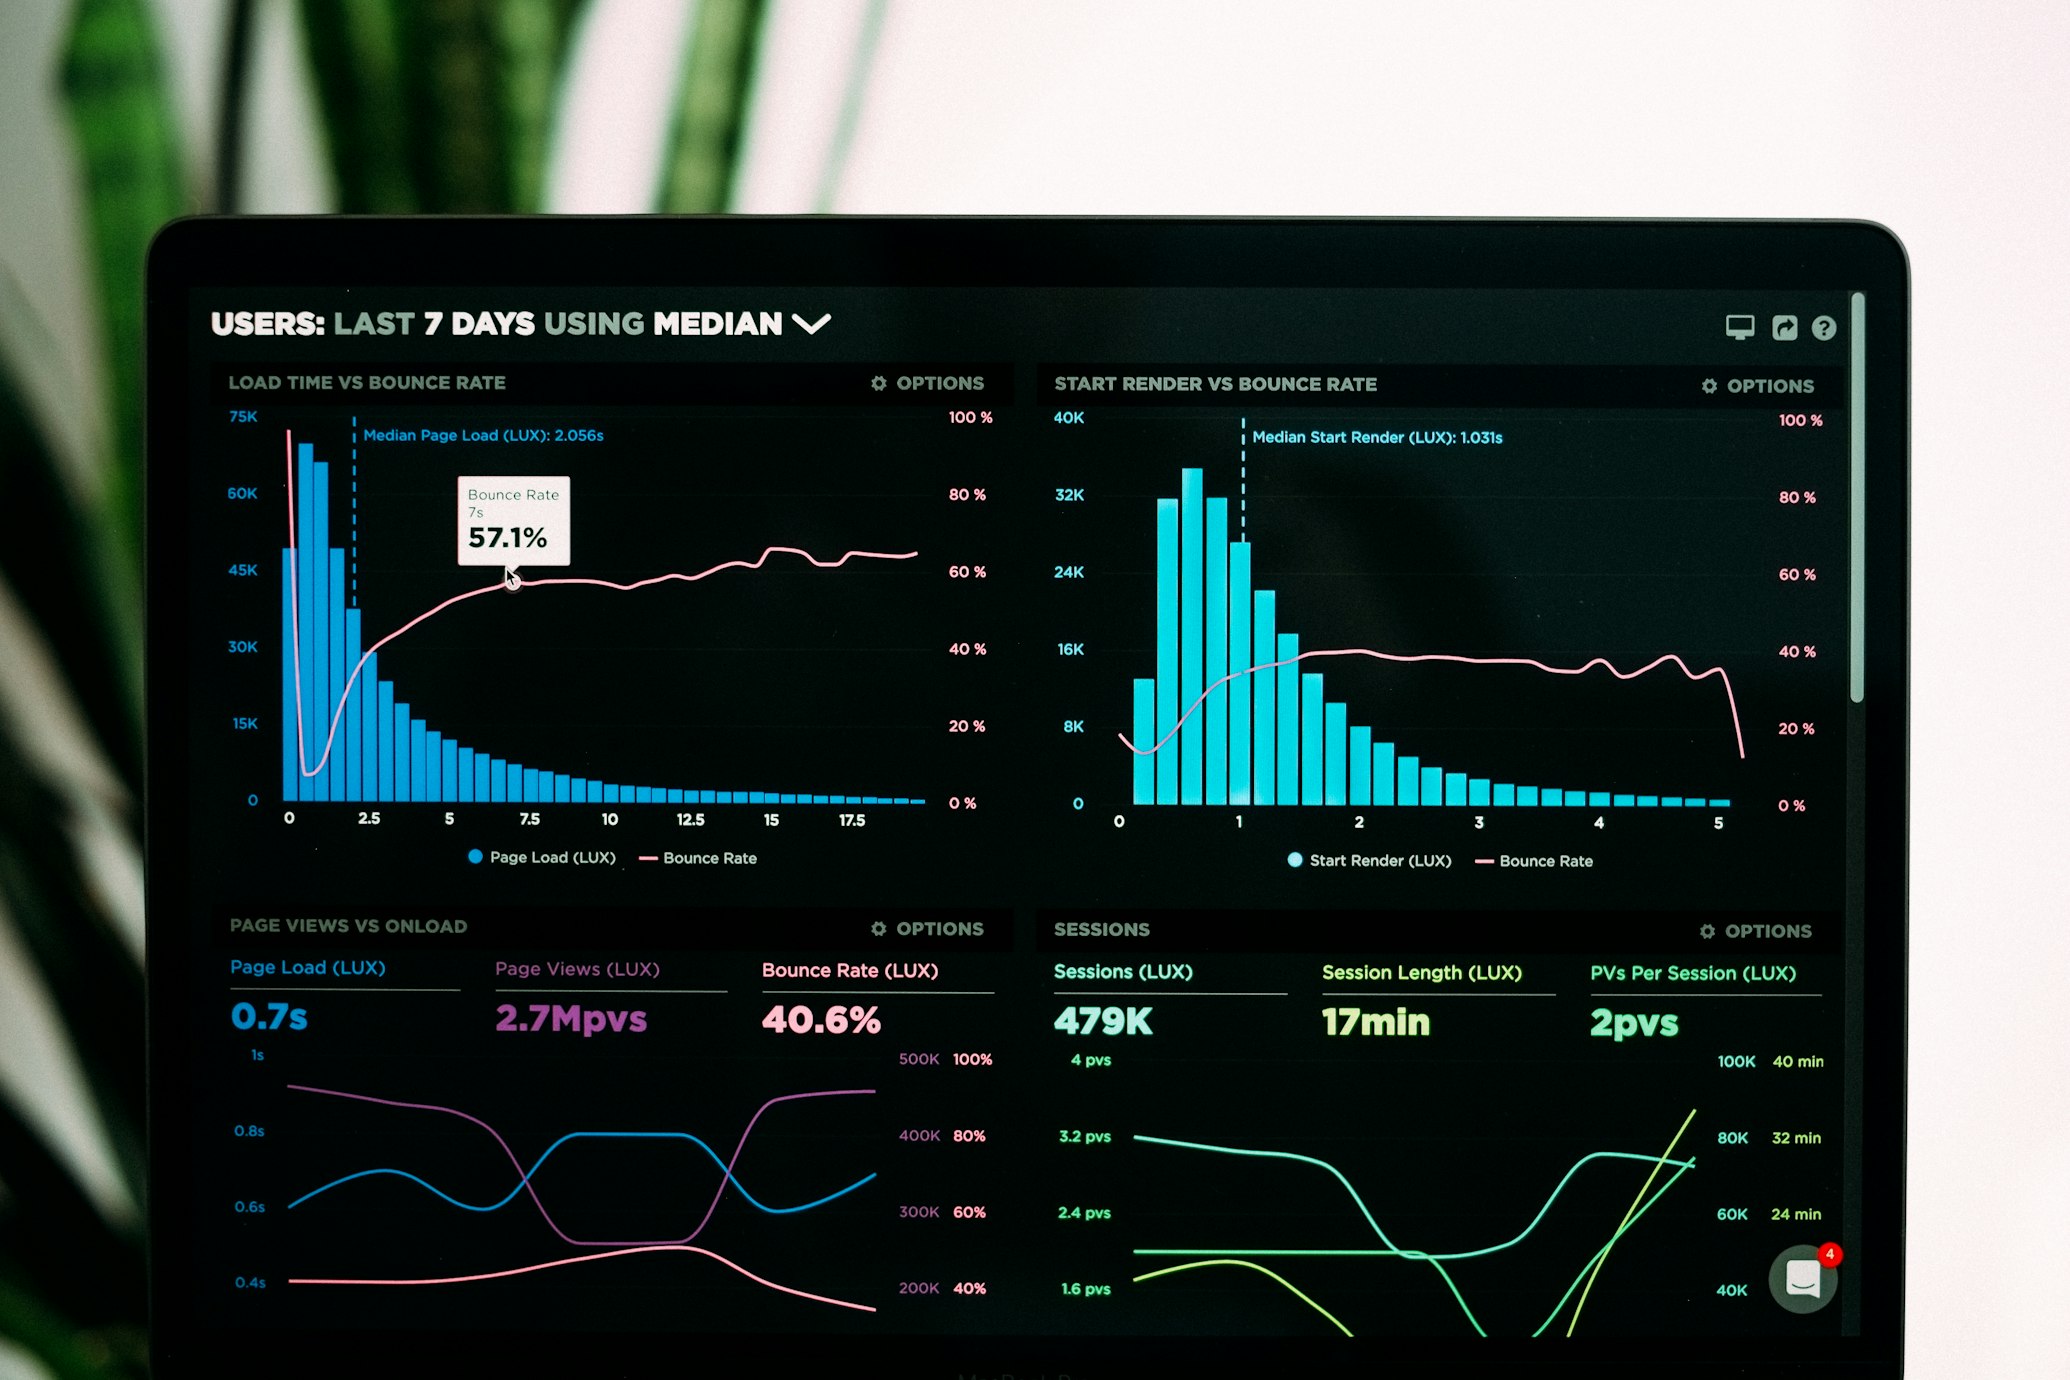
Advanced Analytics with Inversion
Master advanced analytics techniques using Inversion's powerful tools, including predictive modeling, anomaly detection, and creating custom visualizations.

Introduction
Advanced analytics is a critical component of modern data processing pipelines. With Inversion, you can leverage powerful analytics capabilities to extract meaningful insights from your data, identify patterns, predict future trends, and detect anomalies.
In this tutorial, we'll explore Inversion's advanced analytics features and learn how to implement sophisticated analytics solutions for real-world scenarios.
Prerequisites
Before you begin, make sure you have the following:
- An Inversion account (sign up at inversion.ai if you don't have one)
- Inversion CLI installed (see Installation Guide)
- Basic familiarity with data processing concepts
- Understanding of basic statistical concepts
Predictive Modeling
Predictive modeling is a powerful technique that uses historical data to forecast future outcomes. Inversion provides a comprehensive set of tools for building, training, and deploying predictive models.
Building Your First Predictive Model
Let's start by creating a simple predictive model that forecasts sales based on historical data. We'll use Inversion's built-in machine learning capabilities to train and evaluate our model.
// Create a new predictive model
const model = inversion.ml.createModel({
  name: 'sales-forecast',
  type: 'regression',
  features: ['season', 'promotion', 'holiday', 'previous_sales'],
  target: 'sales',
  algorithm: 'gradient-boosting'
});

// Train the model with historical data
await model.train({
  dataSource: 'sales-history',
  splitRatio: 0.8,  // 80% training, 20% validation
  epochs: 100
});

// Evaluate model performance
const metrics = await model.evaluate();
console.log('Model accuracy:', metrics.accuracy);
console.log('Mean absolute error:', metrics.mae);

// Use the model for predictions
const predictions = await model.predict({
  dataSource: 'future-conditions',
  outputField: 'predicted_sales'
});
Anomaly Detection
Anomaly detection is the process of identifying data points, events, or observations that deviate significantly from the dataset's normal behavior. Inversion offers several algorithms for detecting anomalies in your data.
Implementing Real-time Anomaly Detection
In this section, we'll implement a real-time anomaly detection system that monitors sensor data and alerts when unusual patterns are detected.
// Create an anomaly detection pipeline
const anomalyDetector = inversion.createPipeline({
  name: 'sensor-anomaly-detector',
  source: {
    type: 'stream',
    config: {
      connector: 'kafka',
      topic: 'sensor-data'
    }
  },
  processors: [
    {
      type: 'anomaly-detection',
      config: {
        algorithm: 'isolation-forest',
        sensitivity: 0.95,
        features: ['temperature', 'pressure', 'vibration'],
        windowSize: '5m'  // 5-minute rolling window
      }
    },
    {
      type: 'filter',
      config: {
        condition: 'anomaly_score > 0.8'
      }
    },
    {
      type: 'alert',
      config: {
        channel: 'slack',
        message: 'Anomaly detected in sensor {{sensor_id}} with score {{anomaly_score}}'
      }
    }
  ],
  sink: {
    type: 'dashboard',
    config: {
      id: 'anomaly-dashboard'
    }
  }
});

// Start the pipeline
await anomalyDetector.start();
Data Visualization
Effective data visualization is essential for understanding complex datasets and communicating insights. Inversion provides a rich set of visualization tools that can be customized to meet your specific needs.
Creating Interactive Dashboards
Let's create an interactive dashboard that visualizes key metrics and allows users to explore the data.
// Create a new dashboard
const dashboard = inversion.visualization.createDashboard({
  name: 'sales-analytics',
  title: 'Sales Analytics Dashboard',
  refreshInterval: 60  // Refresh every 60 seconds
});

// Add a time series chart
dashboard.addWidget({
  type: 'time-series',
  title: 'Monthly Sales Trend',
  position: { x: 0, y: 0, width: 8, height: 4 },
  dataSource: {
    query: 'SELECT date_trunc("month", date) as month, SUM(amount) as sales FROM sales GROUP BY month ORDER BY month',
    refreshInterval: 3600  // Refresh hourly
  },
  options: {
    xAxis: { field: 'month', type: 'time' },
    yAxis: { field: 'sales', title: 'Sales ($)' },
    series: [{ field: 'sales', color: '#64FFDA' }]
  }
});

// Add a pie chart
dashboard.addWidget({
  type: 'pie',
  title: 'Sales by Category',
  position: { x: 8, y: 0, width: 4, height: 4 },
  dataSource: {
    query: 'SELECT category, SUM(amount) as sales FROM sales GROUP BY category ORDER BY sales DESC'
  },
  options: {
    value: { field: 'sales' },
    label: { field: 'category' },
    colorScheme: 'blues'
  }
});

// Add a data table
dashboard.addWidget({
  type: 'table',
  title: 'Top Performing Products',
  position: { x: 0, y: 4, width: 12, height: 6 },
  dataSource: {
    query: 'SELECT product_name, category, SUM(amount) as sales, COUNT(*) as transactions FROM sales GROUP BY product_name, category ORDER BY sales DESC LIMIT 10'
  },
  options: {
    columns: [
      { field: 'product_name', title: 'Product' },
      { field: 'category', title: 'Category' },
      { field: 'sales', title: 'Sales ($)', format: 'currency' },
      { field: 'transactions', title: 'Transactions' }
    ],
    pagination: true,
    search: true
  }
});

// Publish the dashboard
await dashboard.publish();
Case Study: Retail Analytics
Let's apply what we've learned to a real-world scenario: a retail company looking to optimize their inventory management and marketing strategies using advanced analytics.
The Challenge
Our retail client has the following challenges:
- Accurately forecast demand for thousands of products across multiple stores
- Identify seasonal patterns and trends that affect sales
- Detect anomalies in sales data that might indicate issues or opportunities
- Visualize key metrics for executives and store managers
The Solution
We'll implement a comprehensive analytics solution using Inversion that addresses all these challenges:
- Data Integration: Combine data from point-of-sale systems, inventory management, marketing campaigns, and external sources like weather and local events.
- Predictive Modeling: Build demand forecasting models for each product category, taking into account seasonality, promotions, and external factors.
- Anomaly Detection: Implement real-time monitoring of sales patterns to identify unusual spikes or drops that require attention.
- Interactive Dashboards: Create role-specific dashboards for executives, store managers, and inventory planners.
Conclusion
In this tutorial, we've explored Inversion's advanced analytics capabilities, including predictive modeling, anomaly detection, and data visualization. By leveraging these powerful tools, you can extract valuable insights from your data and make more informed decisions.
As you continue your journey with Inversion, consider exploring more advanced topics such as:
- Deep learning models for complex prediction tasks
- Natural language processing for text analytics
- Computer vision for image and video analysis
- Reinforcement learning for optimization problems
Next Steps
Ready to take your analytics skills to the next level? Check out these related tutorials: